The 10-Yr Treasury yield fell to a level lower than the 3-month Treasury, sparking renewed concerns about a recession and downward pressure in stocks.
So, why is this indicator watched, and how accurate is it?
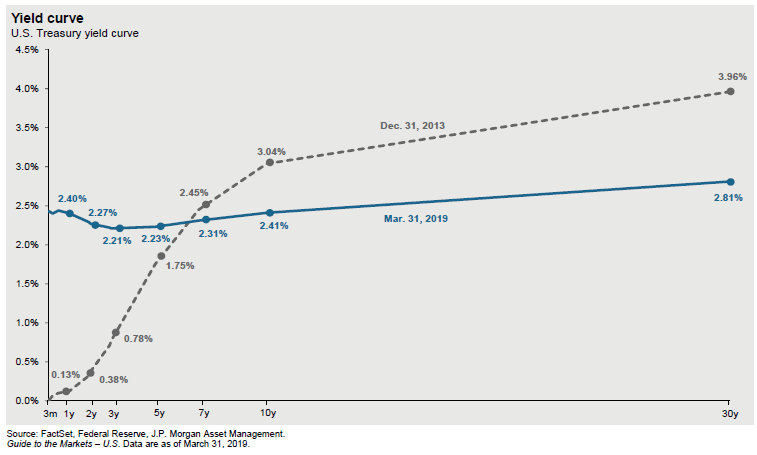
When the yield curve inverts, the yields of certain short-term Treasuries are higher than the yields of long-term Treasuries. A normal yield curve is one where long-term bonds provide a higher yield, given the greater risks associated with the longer holding period until principal is paid.
An inverted yield curve often leads to an expectation of future cuts in short term rates, as well as concerns about slowing economic growth or recession. An inverted yield curve has historically preceded the last seven recessions, however not every yield curve inversion has been followed by a recession.
For example, in 1998 and 1965-66 the yield curve inverted, the Federal Reserve did cut rates, but the economy continued to grow. Even when an inverted yield curve correctly provides a warning for recession, it does not indicate when the recession will occur. The time lag between an inversion of the above-noted section of the yield curve and a recession has been on average 17 months.
Moreover, to be meaningful, the inversion needs to last for months and not weeks. What we don’t know yet is whether the curve will steepen again, or if this is the beginning of a longer duration inversion.
But what does this mean for the stock market?
Interestingly, the stock market still tends to do well after an inverted yield curve. The key is that the yield curve signals a recession in the future. As we said above, it takes on average 17 months before the economy enters a recession following an inversion. Typically, at the end of bull markets, investors overlook the weakening of fundamental data and bid up stocks above their fair value. Historically, stock market performance continues to be positive following a yield curve inversion. Generally, it takes over a year for the market to peak, often with healthy double digit returns during this period.
We don’t know what will happen this bull market, so we will closely monitor the bond market, corporate profits, and global economies in the months ahead.
Is this yield curve inversion like those of the past?
Some would argue that this inversion is different due to various technical issues. As they have been for a while, global yields are much lower than U.S. bond yields. Germany is running a budget surplus but can’t invest in their own bonds because they are yielding negative returns. Looking around the world, the debt of France, the UK and Japan are also sporting historically low yields. This causes a greater demand for U.S. Treasuries, pushing prices higher and yields lower.
Additionally, the 30 Year Treasury yield is still higher than shorter term rates. Often you will see a complete yield curve inversion, which is not what we have today. This fact could be suggesting that the market believes rate cuts are more likely than rate hikes in the future, which could be beneficial for continued economic growth, expansion and corporate profits. It could also be a signal of lower inflation ahead and not a recession. Technological efficiencies have caused muted inflation numbers for the past decade and this trend could certainly continue.
Ultimately, an inverted yield curve is something we closely monitor along with corporate profits in assessing the probability and timing of a recession. We are mindful of a recession’s impact on client portfolios and will closely observe trends which may be clues to its timing.
As always, if you have any questions or concerns, we welcome your thoughts and phone calls.